How to use Metal frame capture outside of Xcode
Some time ago I wrote my own live shader editor for Metal shaders - MetalToy, named after ShaderToy, since I wanted something like shadertoy for Metal. It’s basic but very useful - I can edit shaders in any editor (I use Xcode), hit cmd-s to save and MetalToy will update the live preview.
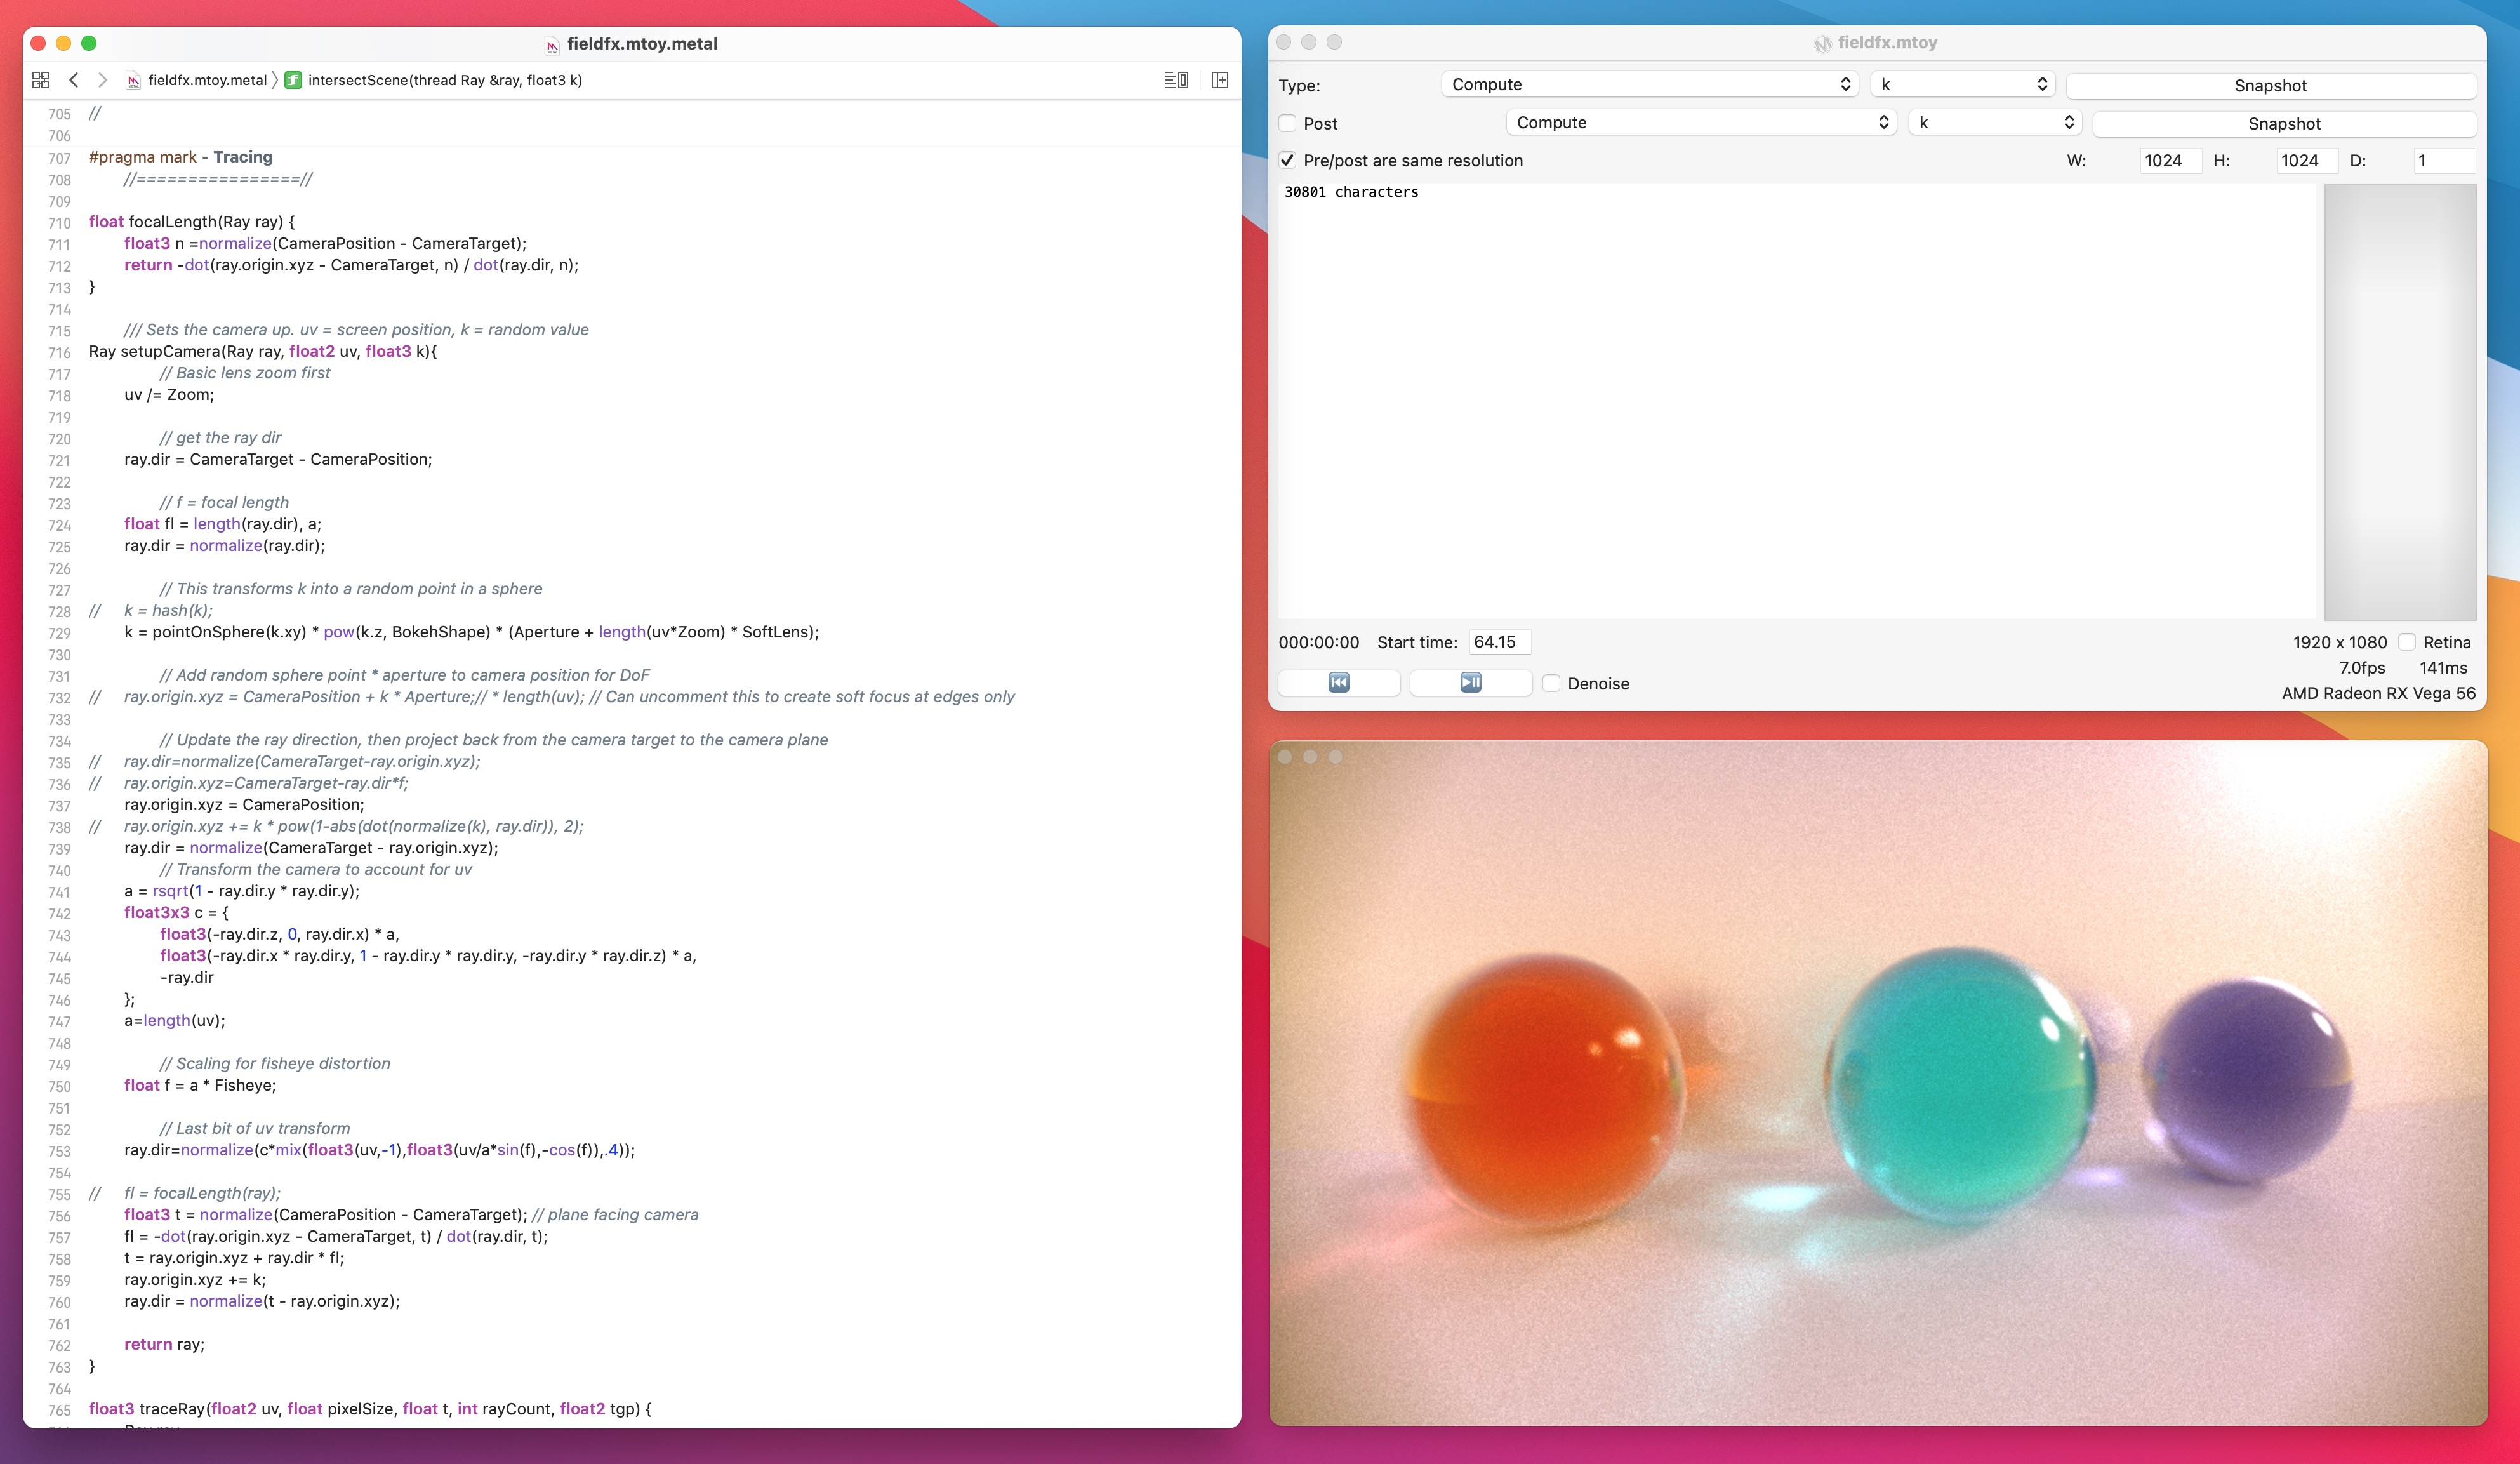
MetalToy looks like this
At some point I’ll clean it up and open source it, but here’s something that might be of use to other mac / iOS devs. Yesterday I was trying to fix a bug in a shader, and I thought
“It’d be so good to have a ‘Debug’ button that fires up a full shader debugger”
It took around 20 minutes to do it :D
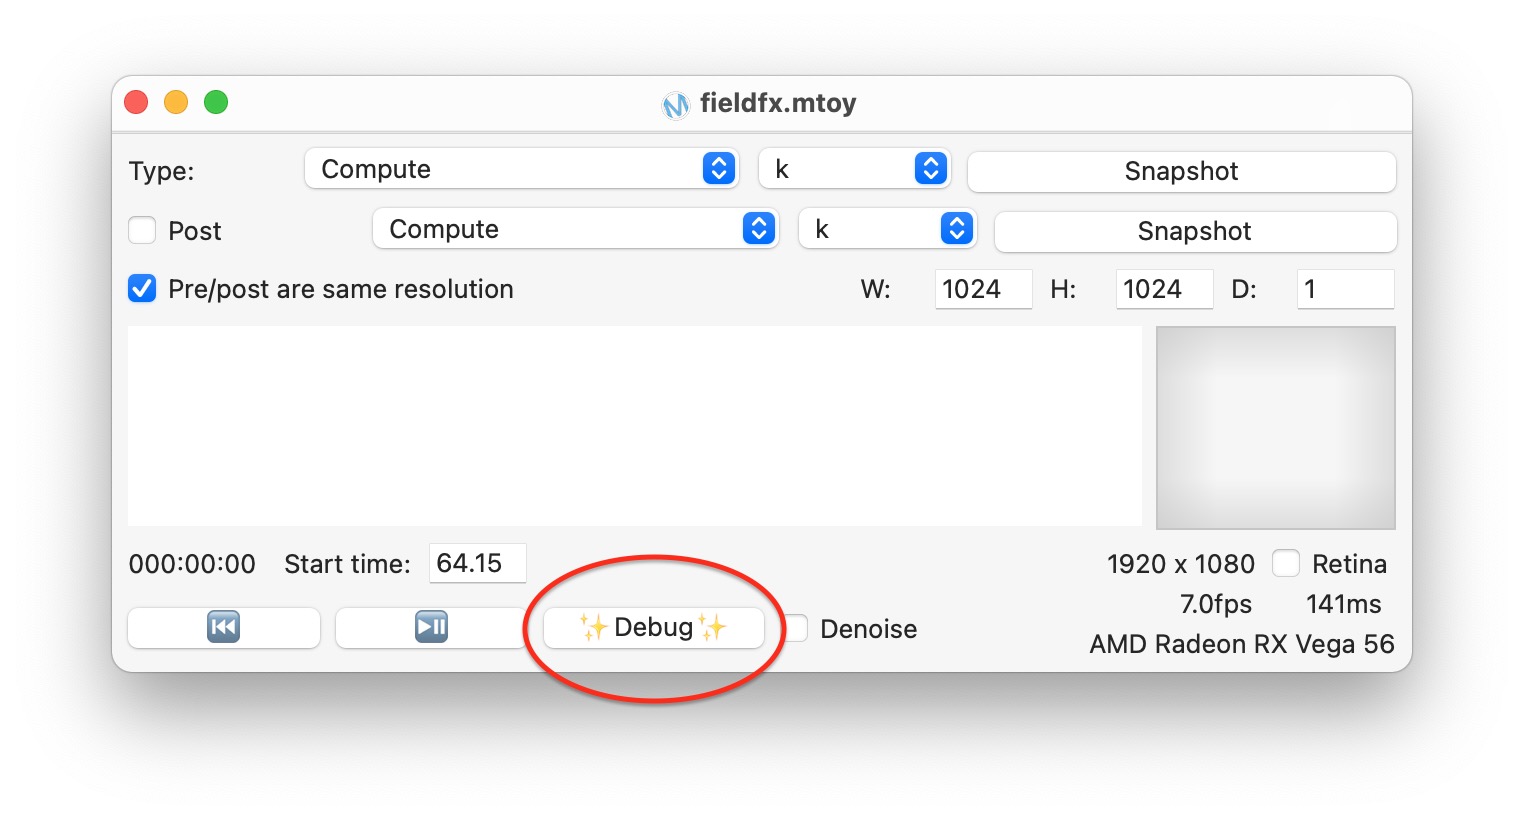
One shiny new Debug button
Don’t build your own GPU debugger
Unless you really want to I guess? Xcode already has some amazing GPU debugging and profiling tools built in, and you can simply hit the frame capture button while debugging your app. This only works if you’re debugging it though.
What I needed was a way to run frame capture outside of Xcode. Turns out Apple anticipated this nicely!
For full details, you can see Apple’s documentation here. Since their docs have a habit of, uh, moving, disappearing or not being updated, I’ll document the process here:
- In your project’s info.plist add the key “MetalCaptureEnabled”, set it to true
- Add code to capture GPU commands. See Apple’s docs on writing frame captures to a file here
In my case I added a ‘Debug’ button. This pauses my MTKView (which just makes things simpler), starts capturing, calls view.draw() and ends. It save a .gputrace (frame capture) file to disk, then asks Xcode to open the file.
That means I can just hit the Debug button at any time in MetalToy and it fires up the full Xcode GPU debugging tools :D
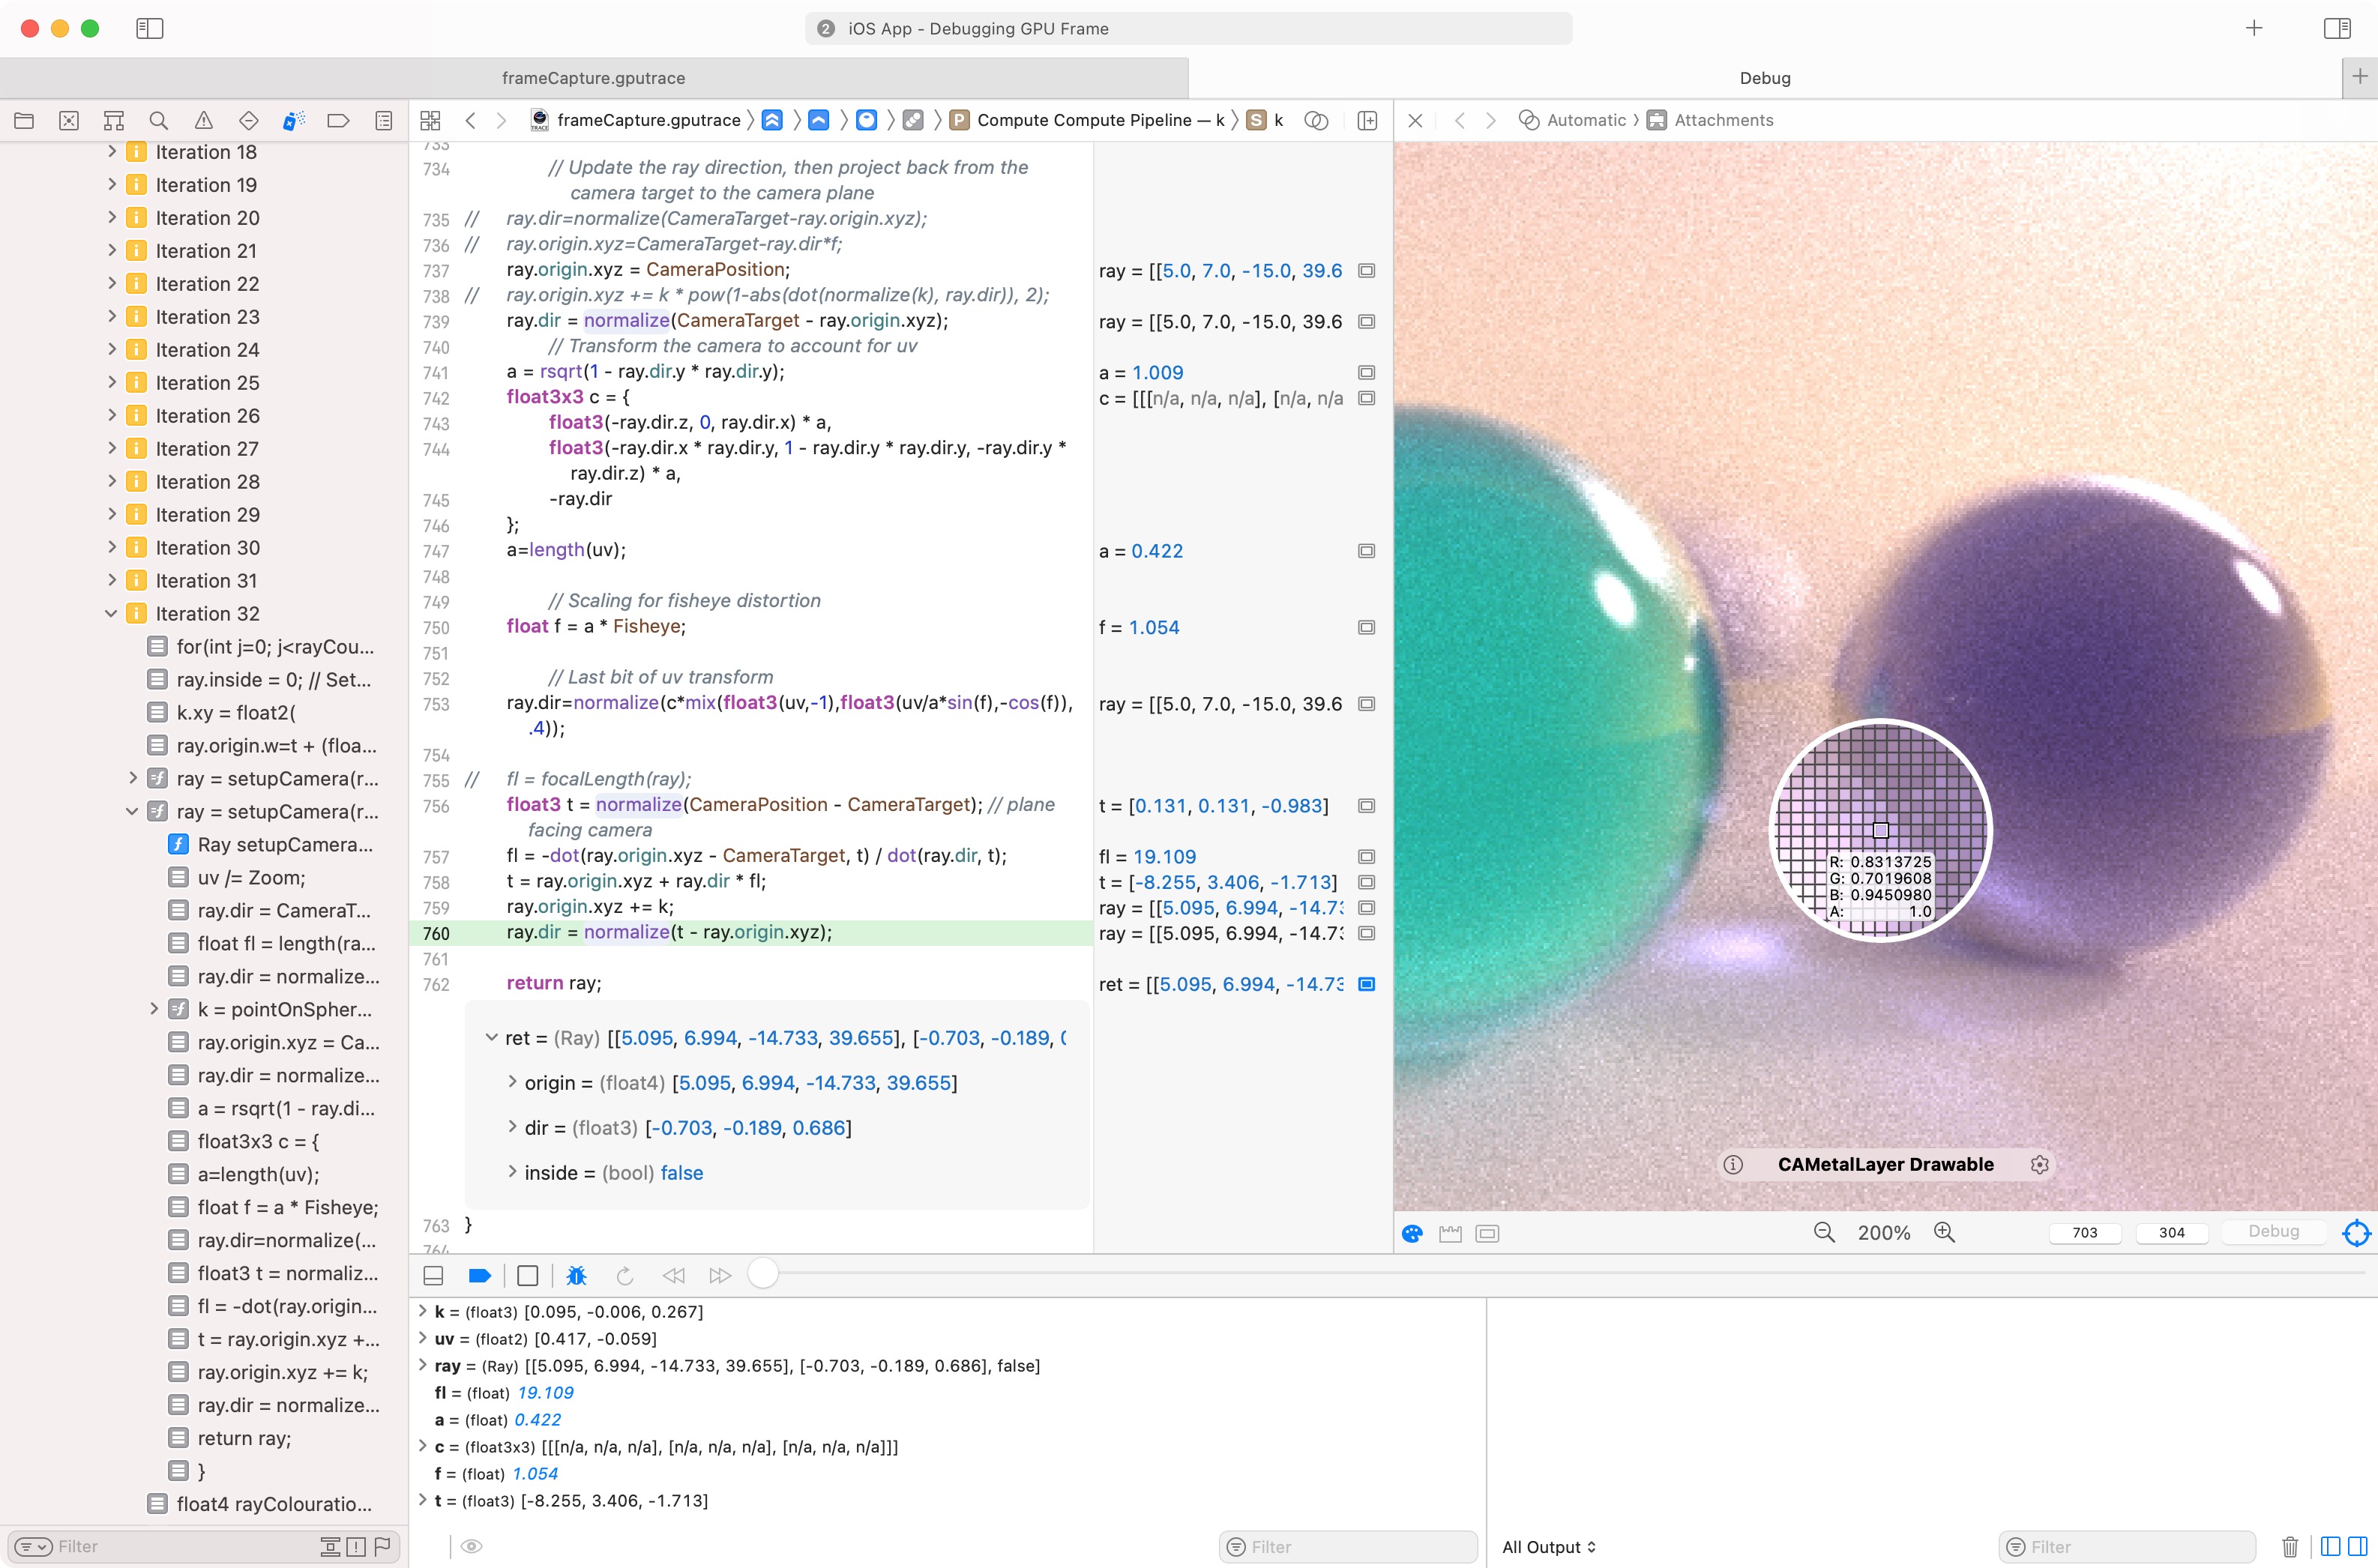
A click of a button, and we have a full shader debugger!
VERY useful for remote debugging
You could also just write the file out and send it to your own server, or ask the customer to email it.
Have a customer who’s seeing an unusual bug you can’t reproduce? Now they can just hit a button, and it’ll send you a frame capture so you can reproduce it instantly.
The Code
Here’s what I did - the Debug button just calls this function:
func captureFrame() {
	// Stop playback if playing
	preview.play = false

	let captureManager = MTLCaptureManager.shared()

	guard captureManager.supportsDestination(.gpuTraceDocument) else {
		print("Capture to a GPU tracefile is not supported")
		return
	}

	// Write file to tmp folder
	let tmpDir = FileManager.default.temporaryDirectory
	let destURL = tmpDir.appendingPathComponent("frameCapture.gputrace")

	// Set up the capture destiptor
	let captureDescriptor = MTLCaptureDescriptor()
	captureDescriptor.captureObject = mtlDev
	captureDescriptor.destination = .gpuTraceDocument
	captureDescriptor.outputURL = destURL

	do {
		try captureManager.startCapture(with: captureDescriptor)
	}  catch let e {
		print("Failed to capture frame for debug: \(e.localizedDescription)")
		return
	}

	// Draw a frame to capture it
	preview.draw()

	captureManager.stopCapture()

	// Open the file in xcode
	let standardPath = destURL.path
	let scriptSource = "tell application \"Xcode\"\nopen \"\(standardPath)\"\nend tell"
	let script = NSAppleScript.init(source: scriptSource)
	DispatchQueue(label: "XcodeOpen", qos: .utility, attributes: [.concurrent], autoreleaseFrequency: .inherit, target: nil).async {
			script?.executeAndReturnError(nil)
	}
}